# Powerpipe: Dashboards for DevOps
> An open-source dashboard server and CLI to visualize your data, manage your security posture, and deliver actionable DevOps intelligence.
By Turbot Team
Published: 2024-03-06
## Introducing Powerpipe
Powerpipe is an open-source tool from [Turbot](https://turbot.com) that supports DevOps with:
**Benchmarks** - [5,000+ open-source controls](https://hub.powerpipe.io) from CIS, NIST, PCI, HIPAA, FedRamp and more. [Run instantly on your machine](/docs#run-security-and-compliance-benchmarks) or as part of your deployment pipeline.
**Relationship Diagrams** - The only dashboarding tool designed from the ground up to [visualize DevOps data](/docs#visualize-cloud-infrastructure). Explore your cloud, understand relationships, drill down to the details.
**Dashboards & Reports** - High-level dashboards provide a quick overview. Use them to highlight misconfigurations and hotspots. [Filter](/docs/run/benchmark/benchmark-dashboard#filtering--grouping), pivot, and [snapshot](/docs/run/snapshots) results.
**Code, not clicks** - Our dashboards are [code](/docs/powerpipe-hcl): version-controlled, composable, shareable, easy to edit — designed for the way you work. [Join](https://turbot.com/community/join) our open-source community!
## About Powerpipe dashboards and benchmarks
Powerpipe supports an ecosystem of [dashboards and benchmarks](https://hub.powerpipe.io/mods). These open-source components use HCL to define and compose elements that include [tables](/docs/powerpipe-hcl/table), [charts](/docs/powerpipe-hcl/chart), [relationship graphs](/docs/powerpipe-hcl/graph), [benchmarks](/docs/powerpipe-hcl/benchmark), and [controls](/docs/powerpipe-hcl/control). And they use SQL to query for the data that animates them, typically by way of a parallel ecosystem of [plugins](https://hub.steampipe.io/plugins) that translate cloud APIs to database tables.
For example, the [AWS Insights](https://hub.powerpipe.io/mods/turbot/aws_insights) mod provides 135+ overview and detail dashboards for AWS services: EBS, ECS, EC2, IAM, and more.
## Use the Powerpipe server to view dashboards
Likewise the [AWS Compliance](https://hub.powerpipe.io/mods/turbot/aws_compliance) mod provides 1100+ controls for Audit Manager Control Tower, AWS Foundational Security Best Practices, CIS, and many more.
Powerpipe [does not require Steampipe](/docs/run#selecting-a-database), but [mods](/docs/build) like `AWS Insights` rely on it. So to run the `AWS Insights` dashboards:
- Install [Powerpipe](https://powerpipe.io/downloads)
- Install [Steampipe](https://steampipe.io/downloads)
- Install the [AWS plugin for Steampipe](https://hub.steampipe.io/plugins/turbot/aws)
Then, in a fresh directory:
- `powerpipe mod init` (Powerpipe always runs in the context of a [mod](/docs/build).)
- `powerpipe mod install github.com/turbot/steampipe-mod-aws-insights` (There are commands for [mod management](/docs/build).)
- `steampipe service start` (Give Powerpipe access to Steampipe plugins.)
- `powerpipe server` (Many commands run client-only but dashboards use a server.)
- browse to http://localhost:9033
Dashboards are grouped by AWS service, here's the overview for EC2 instances.

And here's the detail view for an instance, featuring a relationship graph that shows what it mounts, runs as, and connects to.

Although these dashboards use [Steampipe plugins](https://hub.steampipe.io/plugins), you can also connect Powerpipe to Postgres, SQLite, MySQL, or DuckDB. [This mod](https://hub.powerpipe.io/mods/turbot/rnacentral/dashboards), for example, visualizes biomedical data in a hosted instance of Postgres.
## Use the Powerpipe server to run benchmarks
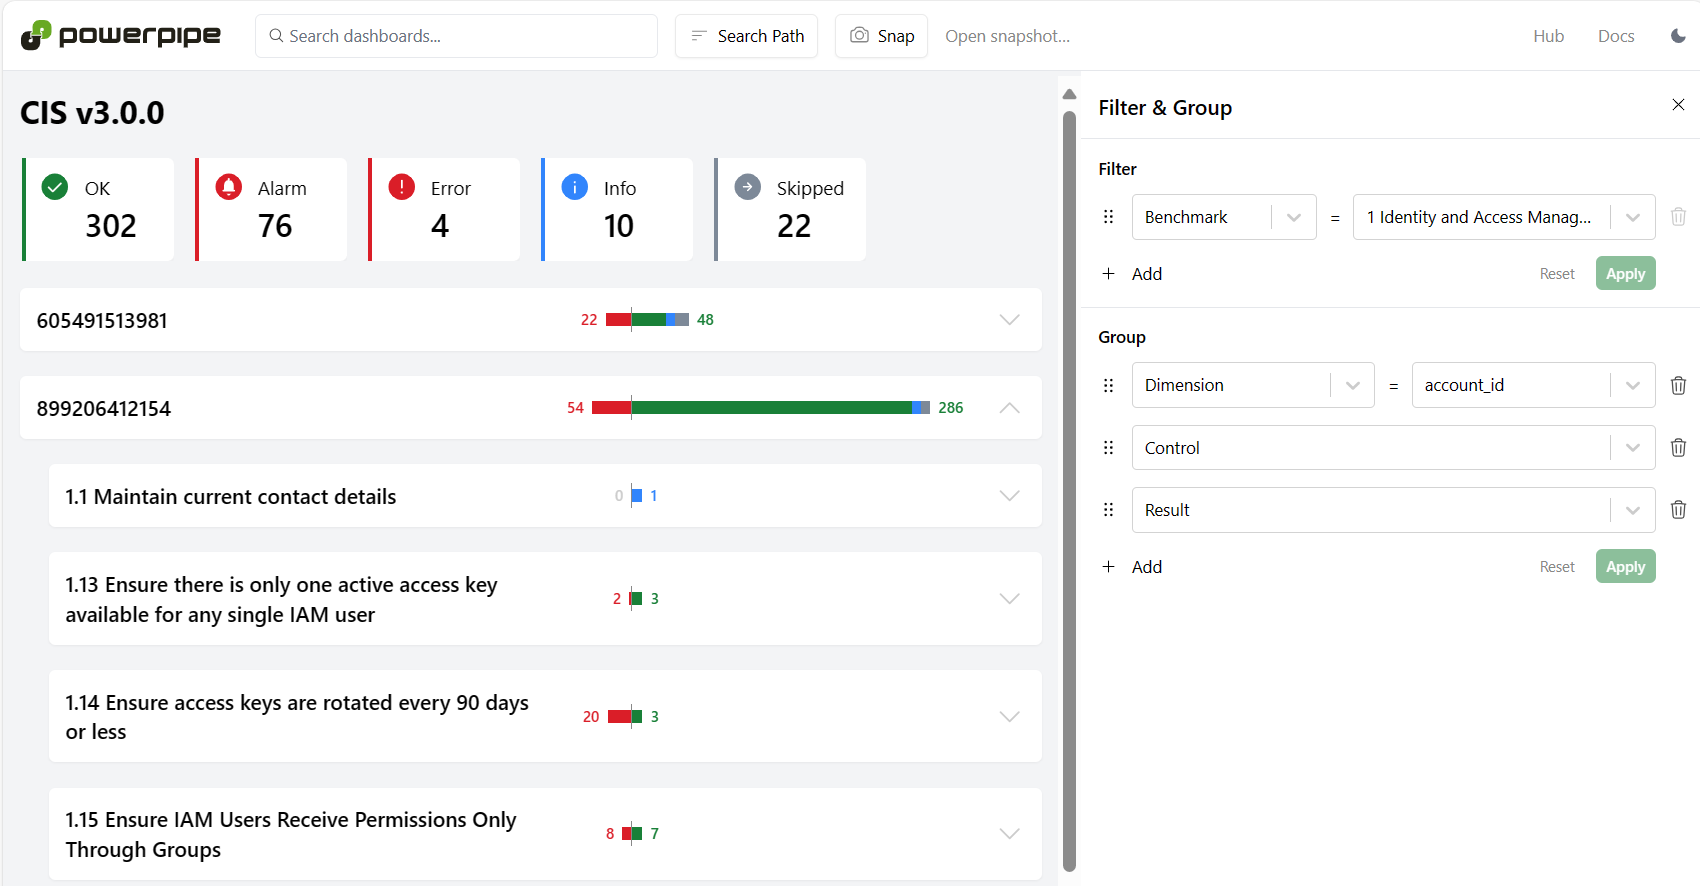
To run the AWS Compliance benchmarks, follow the same recipe but use https://hub.powerpipe.io/mods/turbot/aws_compliance. These dashboards are grouped by benchmark, here's the CIS v300 benchmark.

You can adjust how results are filtered and grouped. Here we filter to just section 1, and group by `account_id`.
## Use the Powerpipe CLI to run benchmarks
You can alternatively run that same benchmark, from the same folder. List the benchmarks.
```
powerpipe benchmark list
```
Run a benchmark.
```
powerpipe benchmark run cis_v300
```
The [documentation](/docs/reference/cli/benchmark#powerpipe-benchmark-run) covers a range of options including `--export` to save results in `asff`, `csv`, and other file formats, and `--snapshot` to create a snapshot [in Turbot Pipes](https://steampipe.io/blog/release-0-17-0#share-snapshots-with-steampipe-cloud).
## Compose and create dashboards and benchmarks
The thousands of pre-built dashboards and benchmarks on the hub are all available for [reuse and remixing](https://steampipe.io/blog/remixing-dashboards). You can use [mod management commands](/docs/reference/cli/mod) to [create your own mod](/docs/build/create-mod), install a local copy of one or more published mods, rearrange the resources they provide, and add your dashboards or benchmarks. Or you can create your own [dashboards](/docs/build/writing-dashboards) and [benchmarks](/docs/build/writing-dashboards) from scratch. In either case, you use HCL to define these elements, and SQL to fill them with data.
Here's a simple dashboard to chart Turbot blog posts by month. It uses the [RSS plugin](https://hub.steampipe.io/plugins/turbot/rss) to aggregate posts and the [chart](/docs/powerpipe-hcl/chart) resource to visualize the data.
```hcl
dashboard "blog_posts" {
title = "Blog posts"
chart {
type = "column"
title = "posts by month"
sql = < 0 then 'ok'
else 'alarm'
end as status,
case
when jsonb_array_length(categories) > 0 then 'Has ' || jsonb_array_length(categories) || ' categories'
else 'Must have at least one category'
end as reason,
title,
categories::text
from
rss_item
where
feed_link = 'https://turbot.com/blog/feed.xml'
EOT
}
```
A [benchmark](/docs/powerpipe-hcl/benchmark) lists one or more child [controls](/docs/powerpipe-hcl/control). Each control runs a query that reports the [required columns](/docs/powerpipe-hcl/control#required-control-columns) `status`, `reason`, and `resource`, along with optional dimensions — in this case, `title` and `categories`.
## See it in action
## Data visualizations and compliance controls as code
Powerpipe is a flexible open-source platform to visualize and monitor your cloud infrastructure, ensure security compliance, and even build your own custom dashboards and benchmarks. With pre-built modules connecting to AWS, Azure, GCP, and more, along with easy ways to create and share your own mods, Powerpipe is an essential GitOps-friendly tool for DevOps teams wrangling cloud complexity. To get started, [download](/downloads) the tool, follow the [tutorial](/docs), explore the [mods](https://hub.powerpipe.io), then [let us know](https://turbot.com/community/join) how it goes!