Dashboards for DevOps.
Visualize cloud configurations. Assess security posture against a massive library of benchmarks. Build custom dashboards with code.


Fall in love with our massive library of dashboards, and stay for our incredible community!
- We turned to Steampipe to present a unified view, as our migration control tower.
 François de MetzSoftware Developer
 - Trivial to connect live cloud configuration data with internal or external data sets & create security or compliance dashboards
 Thoughtworks Radarthoughtworks.com
 - Steampipe dashboards are perfect for us. We can easily build a proof-of-concept, then iterate in real-time.
 Ellis ValentinerLead Data Scientist - Virtual Facility
 - Asset inventory dashboards help us understand our cloud environment better and make our environment more efficient.
 Cobalt pentestercobalt.io
 - Its so easy to represent your desired data.
 Stephen JonesCloud Delivery Architect
 - Solves the context-switching problem, no more back and forth between tools.
 Deepak PatilDevOps Associate
 - Powerful way to analyze your cloud infrastructure with flexibility to customize views and track compliance across multi-cloud.
 Vishal GuptaSenior Member of Technical Staff
 - Awesome project, team! Just this week I noticed the dashboard feature which is so damn cool.
 Seth ArtCloud Penetration Testing Lead
 - Shortly after discovering this, we quickly started assessing ~300 AWS accounts against the AWS Well Architected Framework Reliability Pillar.
 Ciaran FinneganPractice Lead, Cyber Security
 - One of my favorite AWS security tools. Its super convenient.
 Abhay BhargavFounder & CEO of we45
 - Got seduced by this gem!
 Mostefa BrouguiSr. Security Engineer
 - Was able to build a pretty nifty tool set and use this for the visualization.
 Paul StagnerSoftware Engineer
 - There's all sorts of security use cases for this , and it's all OSS.
 Jamie FinniganProduct security @hashicorp
 - Very easy to install and use, it not only provides reports but also interactive dashboards.
 Charles GuebelsCloud Engineering Expert @ ARHS Developments
 - It's like an is an open source Cloud Management Platform (CMP) for our org.
 Ravish TiwariSenior Cloud Architect
Features
Dashboards & Visualization for DevOps Teams
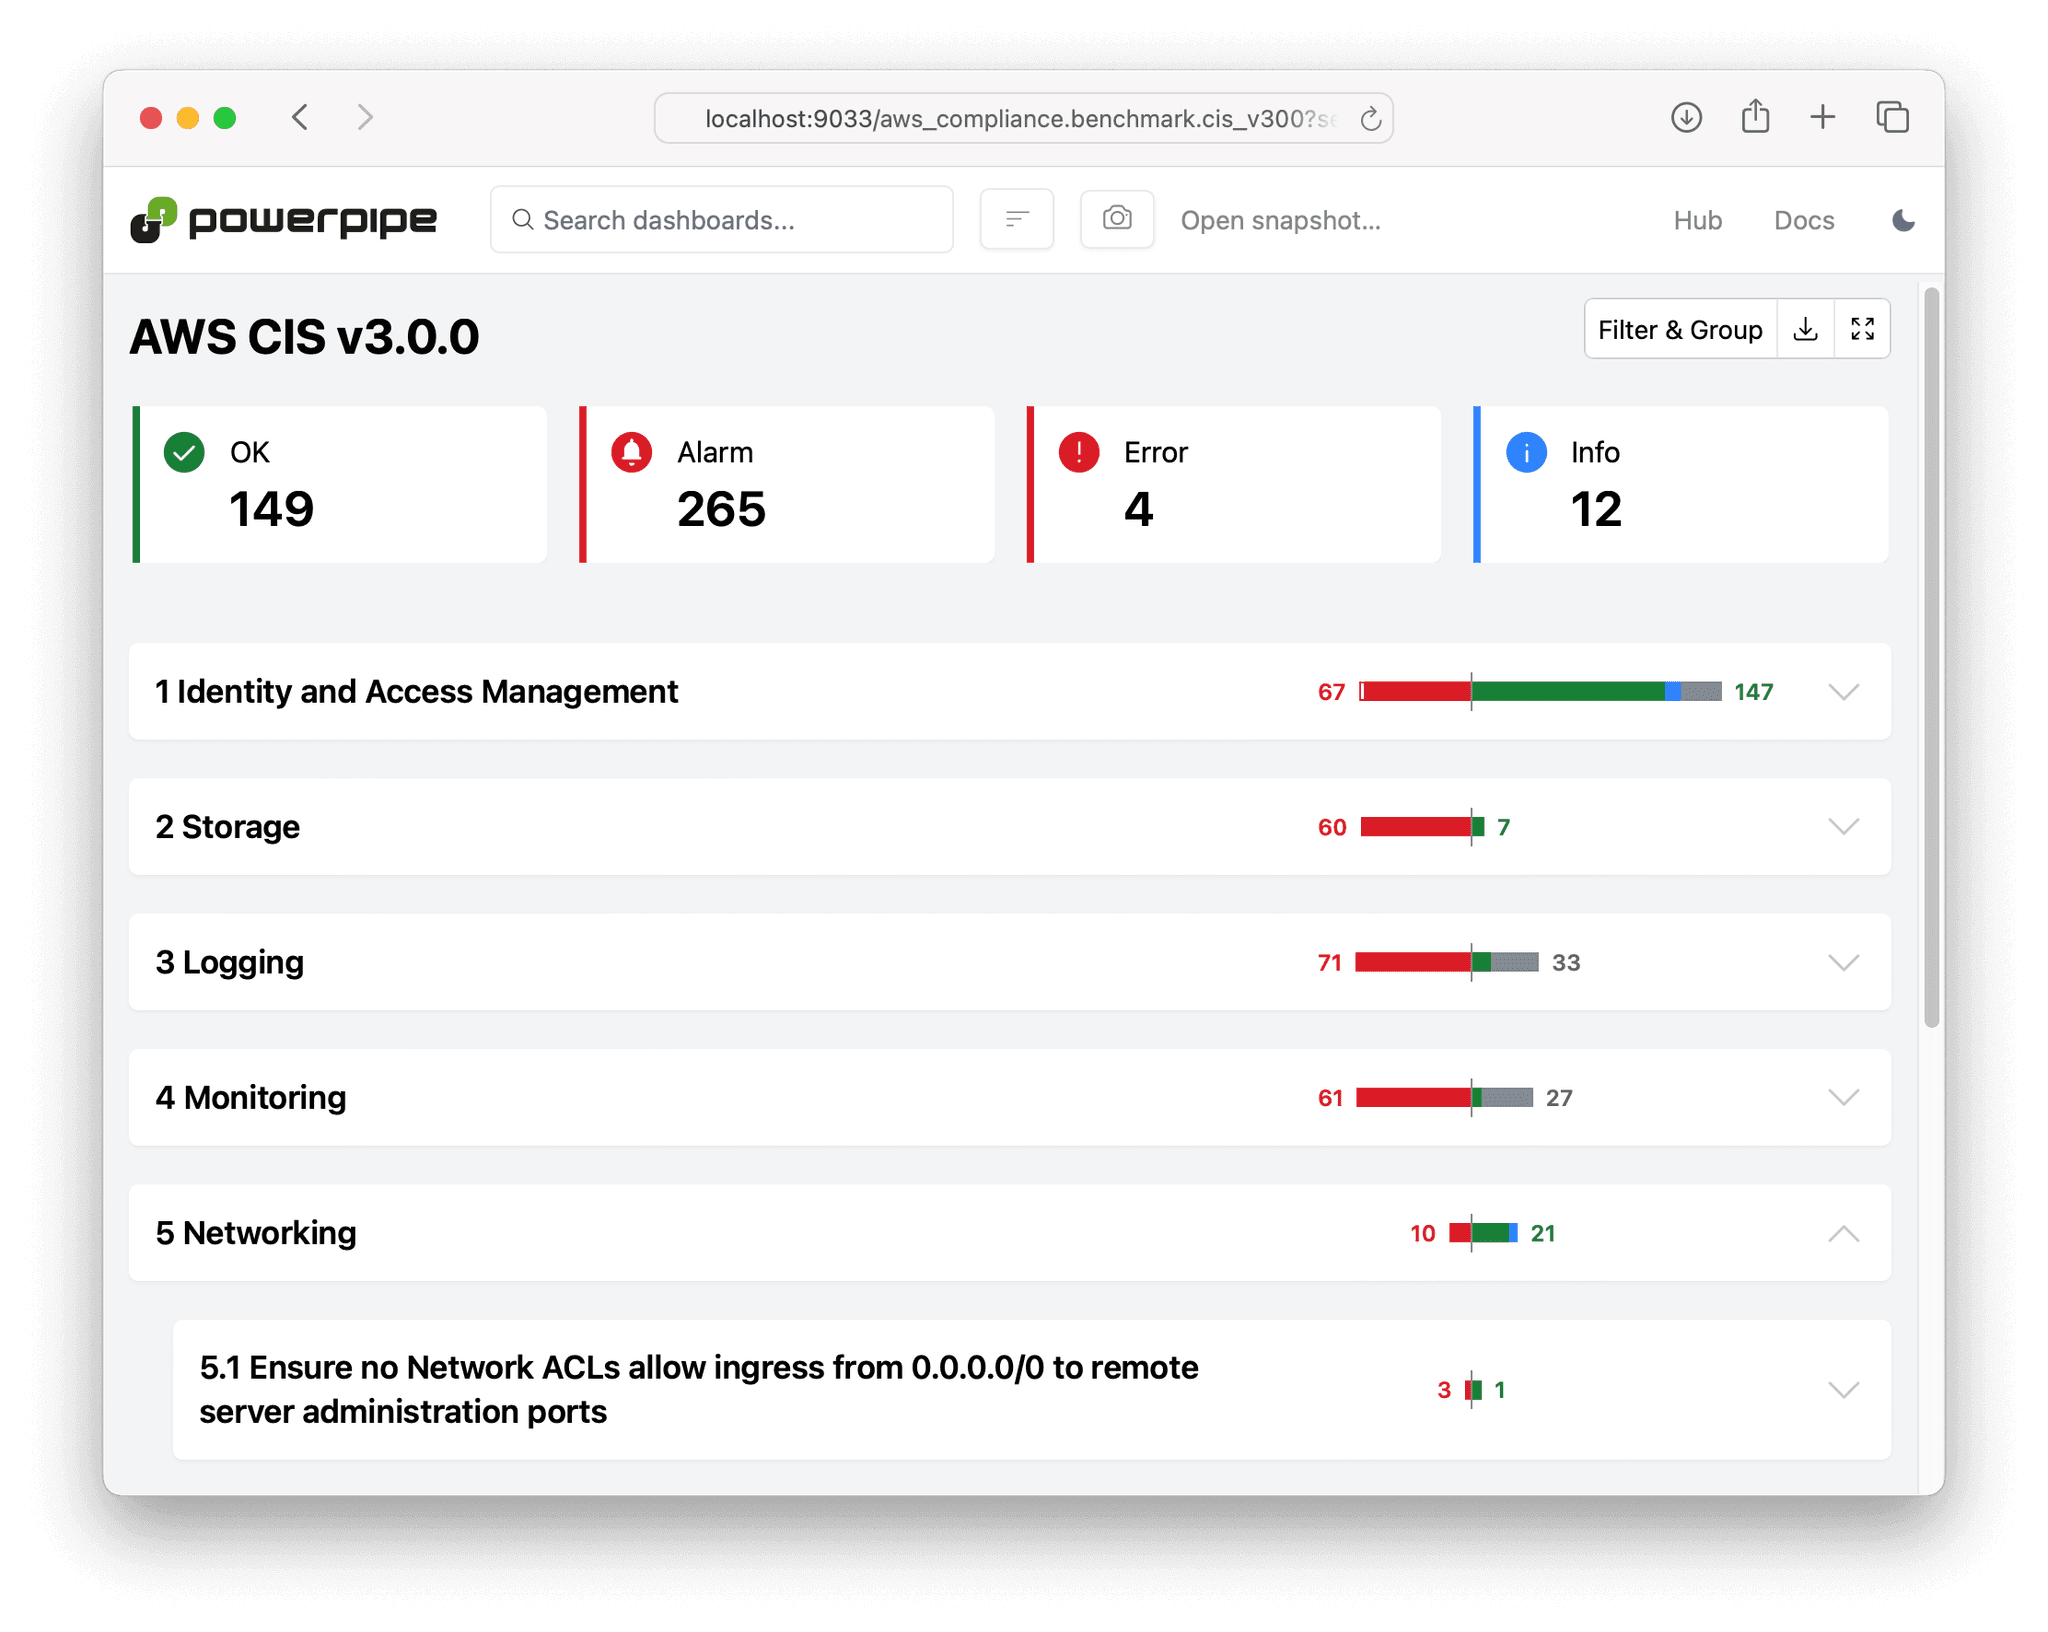
Benchmarks
5,000+ open-source controls from CIS, NIST, PCI, HIPAA, FedRamp and more. Run instantly on your machine or as part of your deployment pipeline.
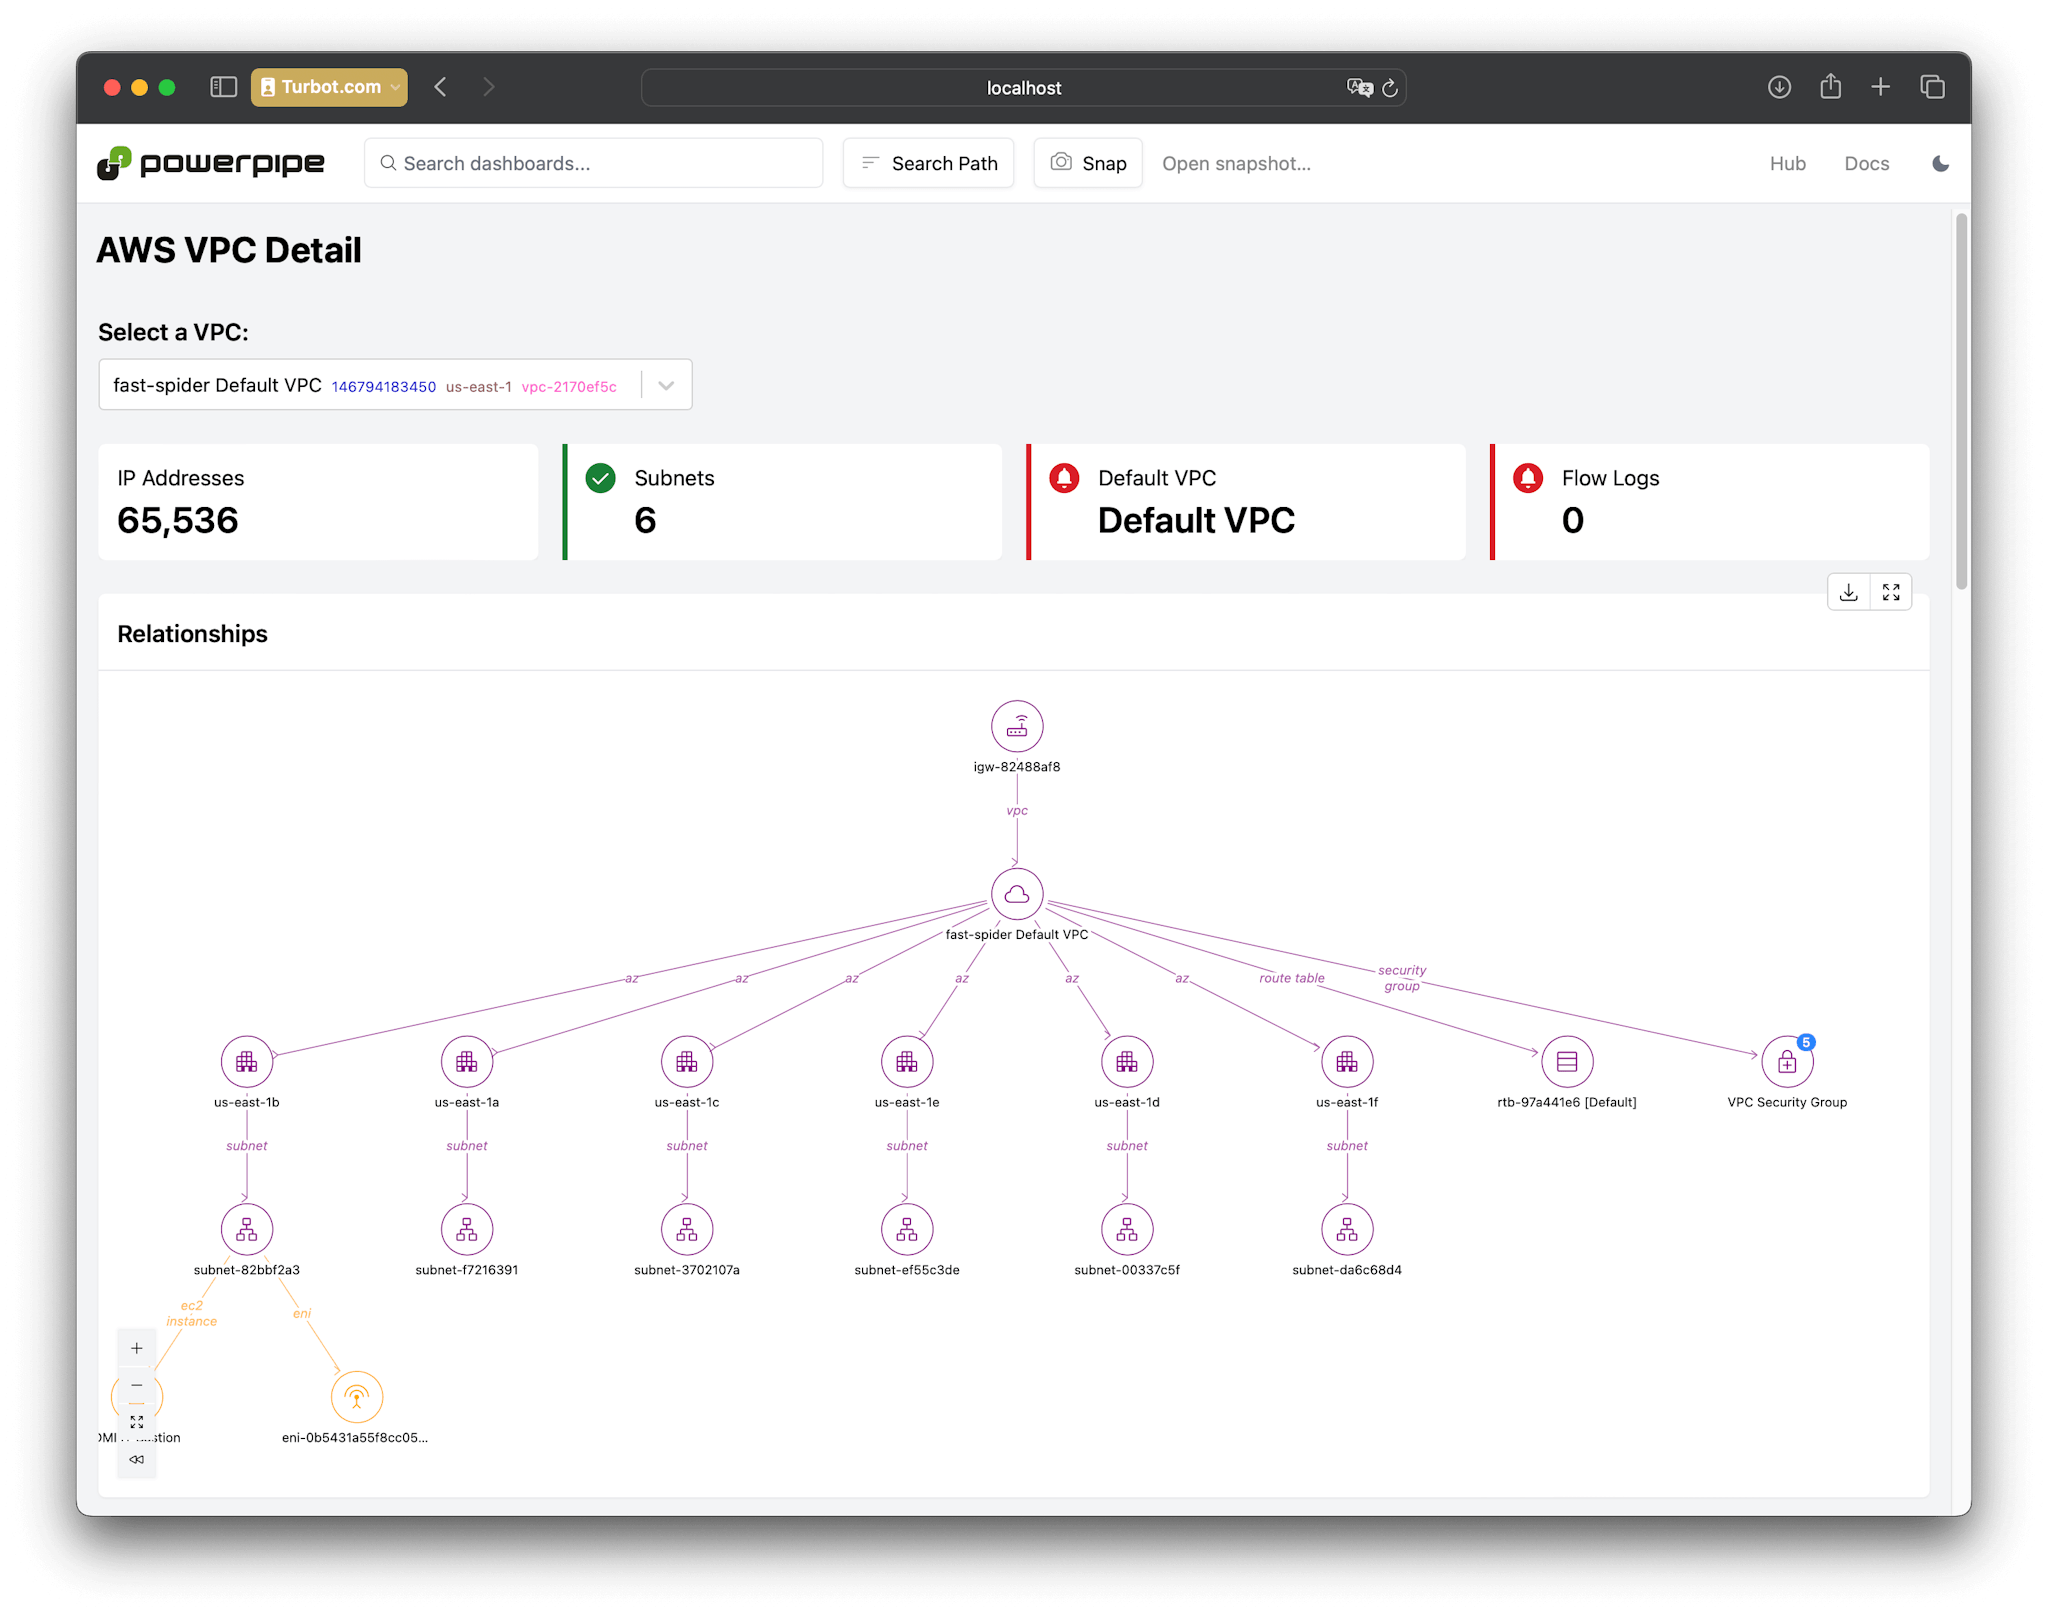
Relationship Diagrams
TailThe only dashboarding tool designed from the ground up to visualize DevOps data. Explore your cloud, understand relationships and drill down to the details.
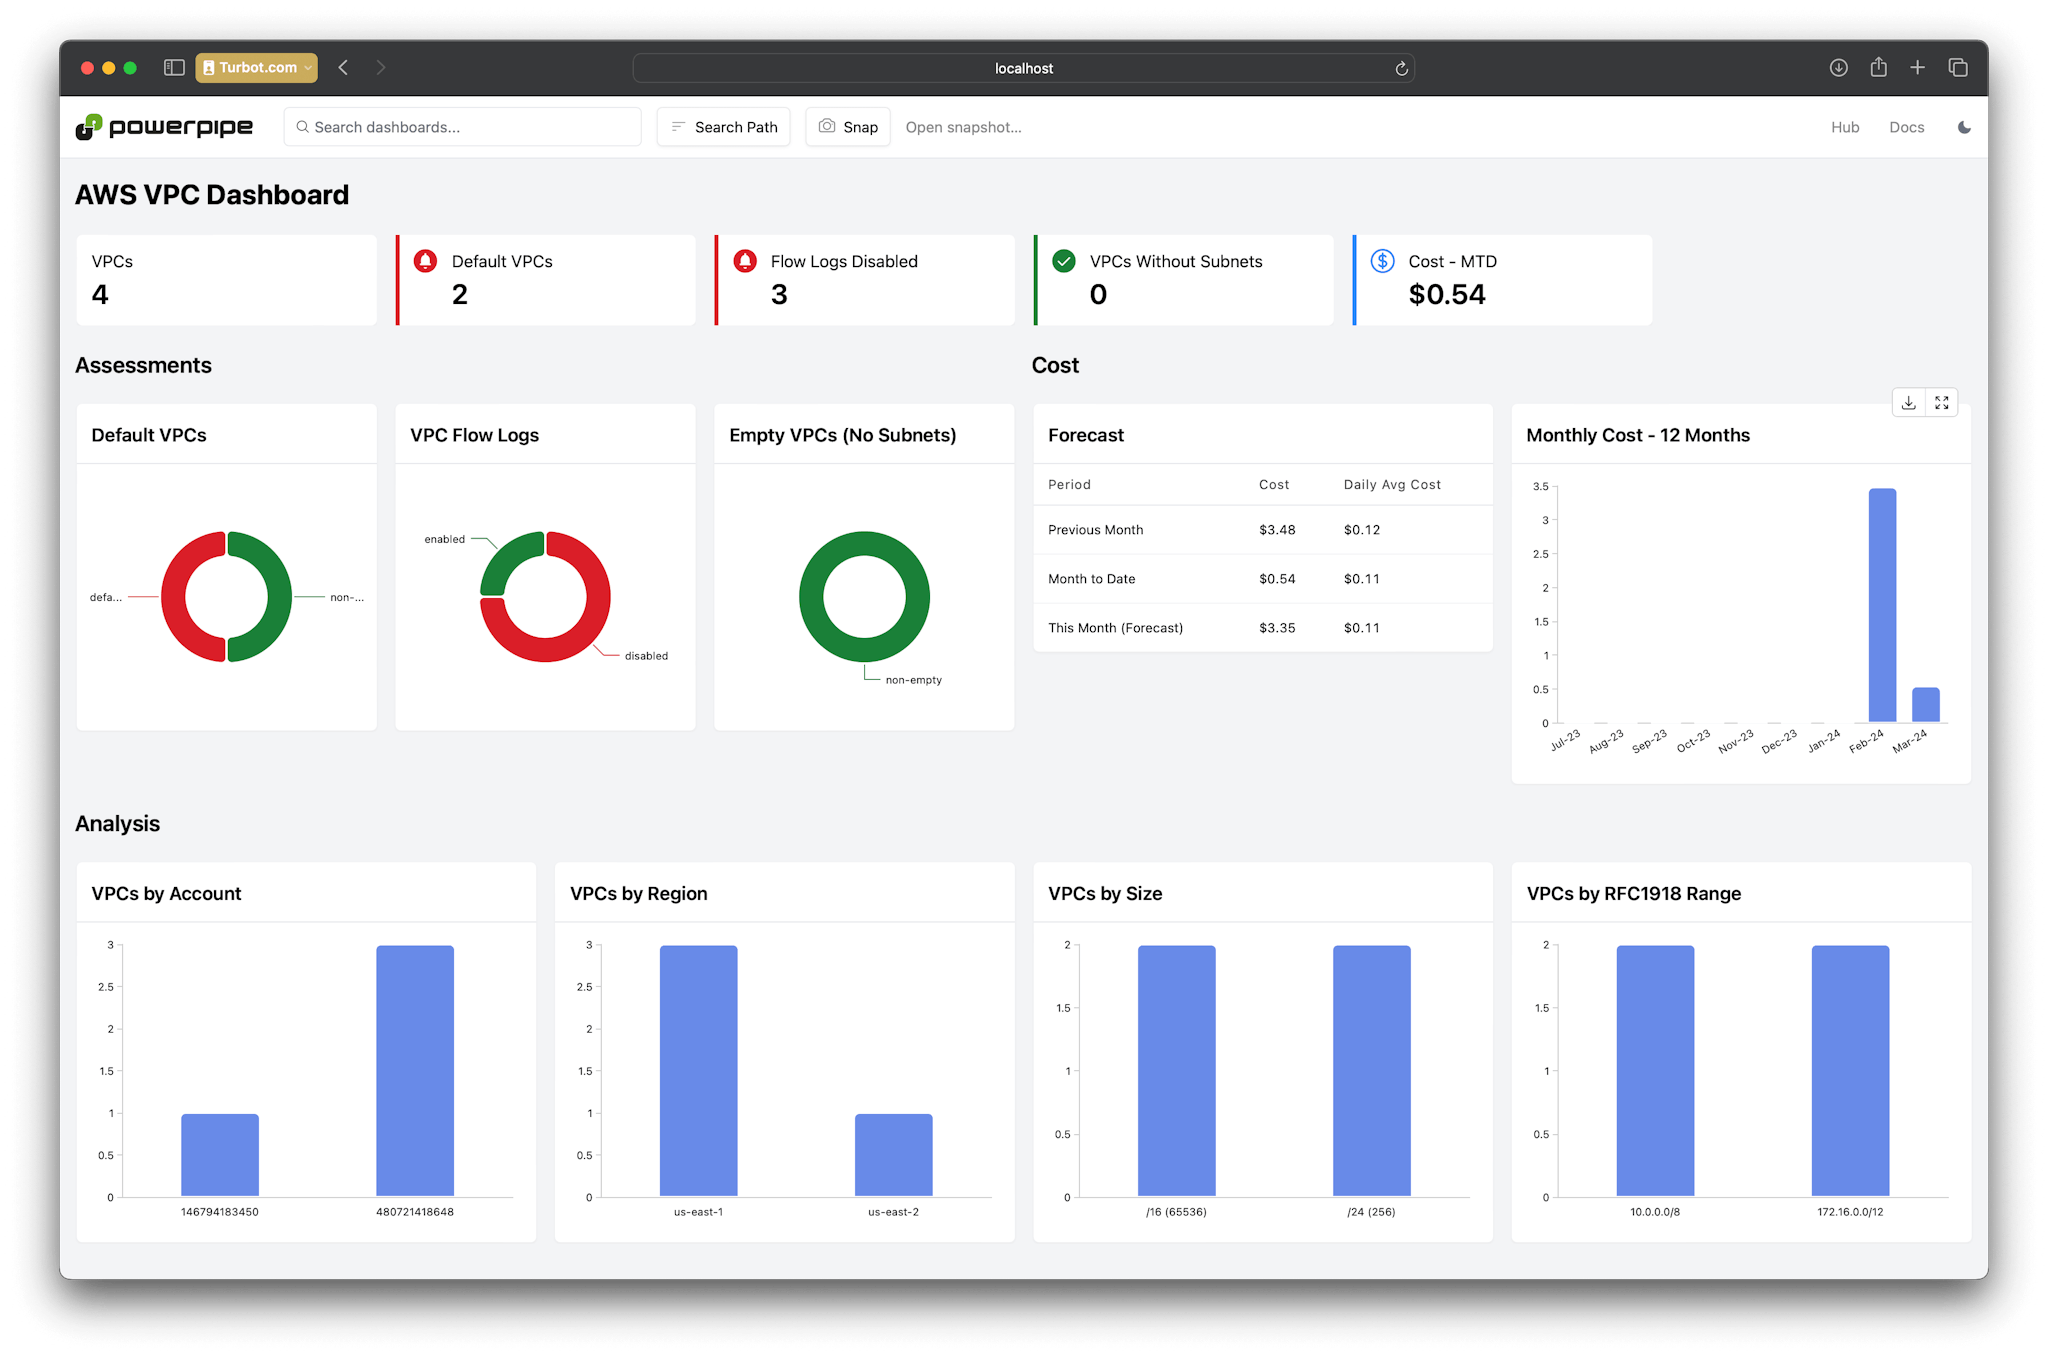
Dashboards
High level dashboards provide a quick management view. Reports highlight misconfigurations and attention areas. Filter, pivot and snapshot results.
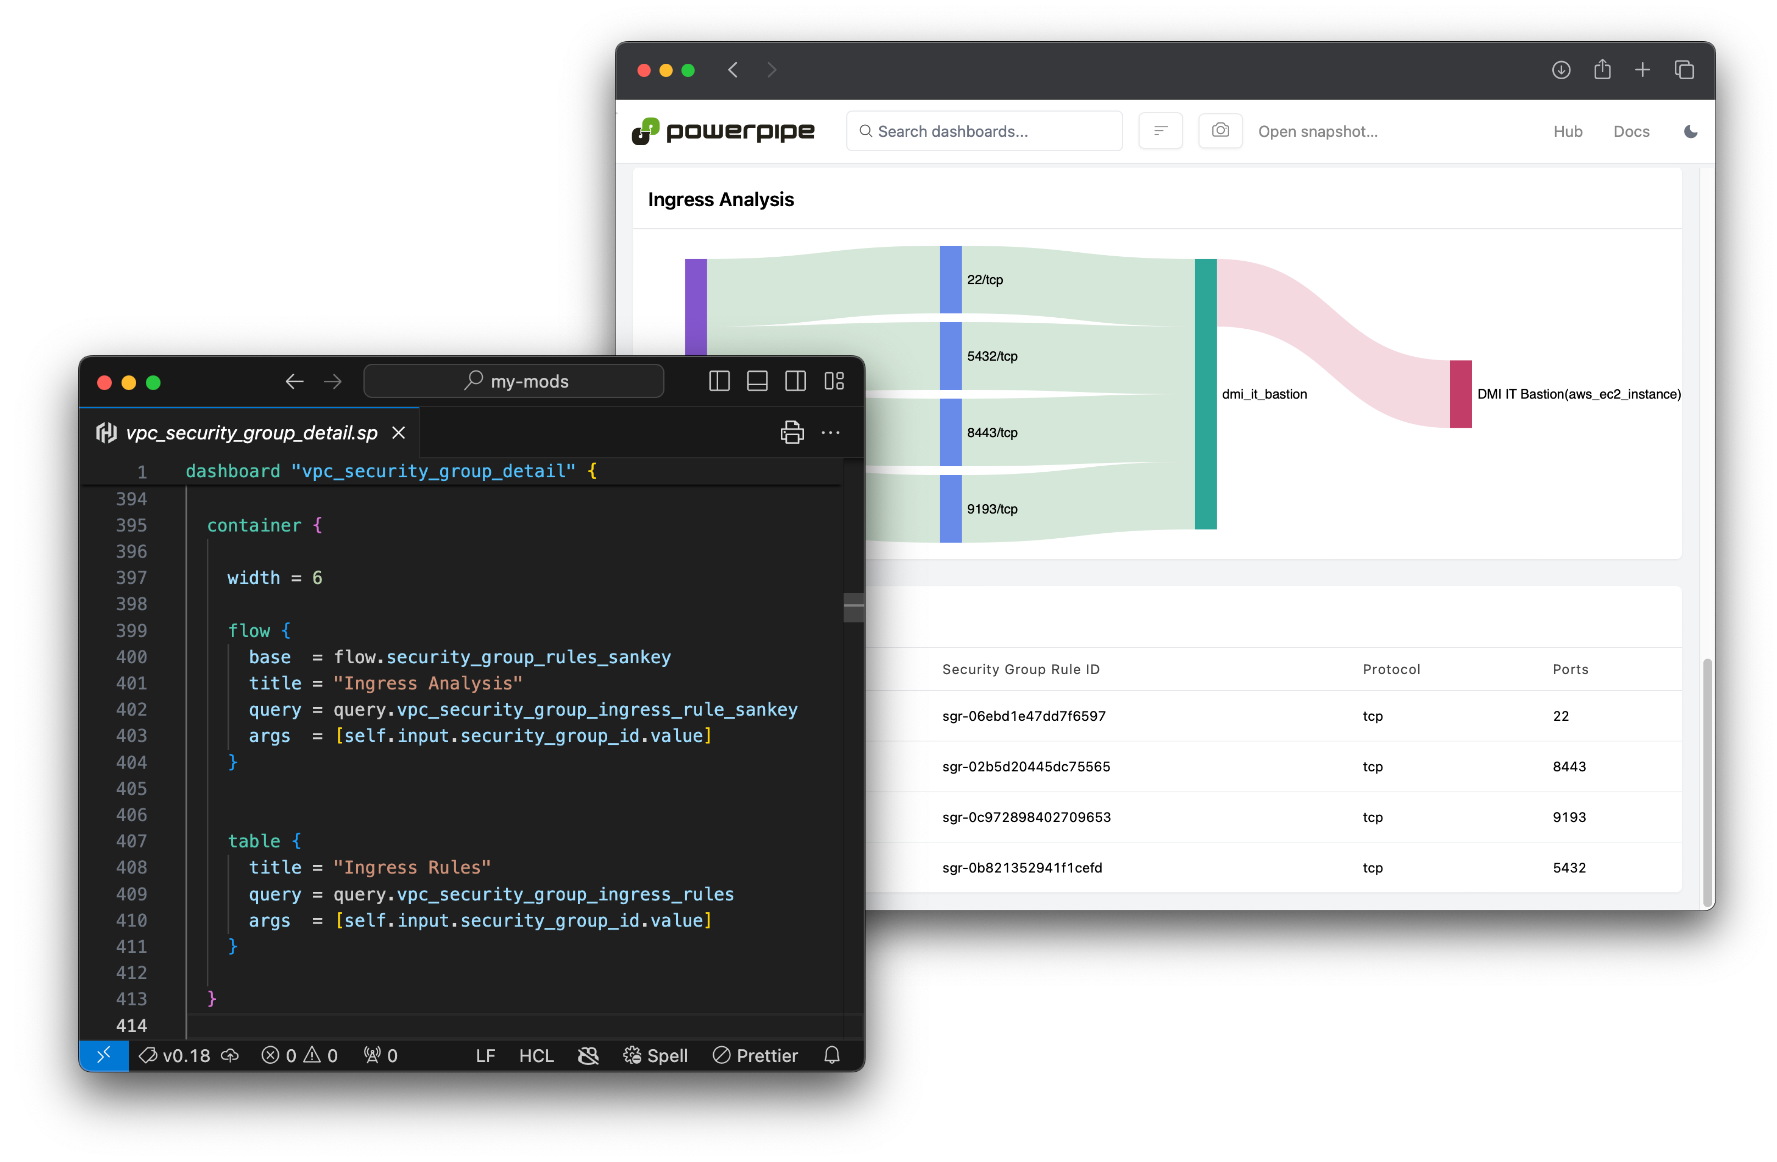
Code, not clicks
Our dashboards are code. Version controlled, composable, shareable, easy to edit - designed for the way you work. Join our open-source community!
Use Cases
Transform real-time data into
signals for proactive decision-making.
Security & Compliance
Identify and monitor security metrics, alerts and compliance status. Track progress on resolving vulnerabilities over-time.
Cost Management
Track cloud utilization and costs. Reduce operational costs by analyzing trends and identifying underutilized resources.
Detections
Run detection benchmarks across your logs to identify unusual activity and attacks.
Asset Inventory & Insights
Use dashboards to explore the relationships, configuration and status of servers, containers, cloud services and networking.
How It Works
Get started building dashboards in <60sec.
Get started fast
Install Powerpipe locally, use a prebuilt container or build it directly from source.
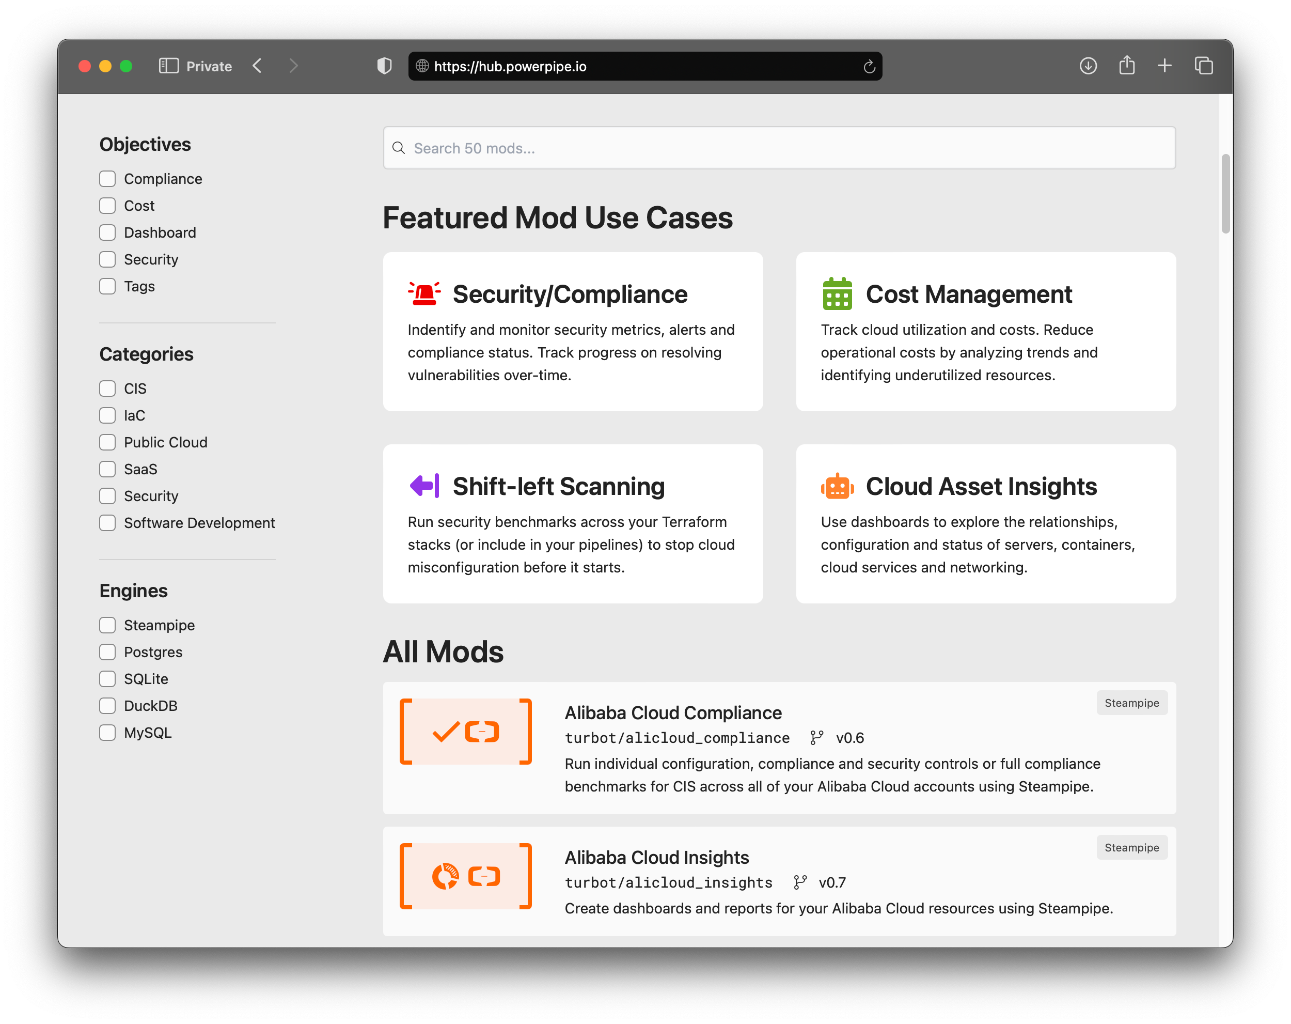
Get inspired
Explore hundreds of open dashboards, benchmarks and examples on the Powerpipe Hub.
Install mods locally
Manage your compliance and security benchmarks just like your code.
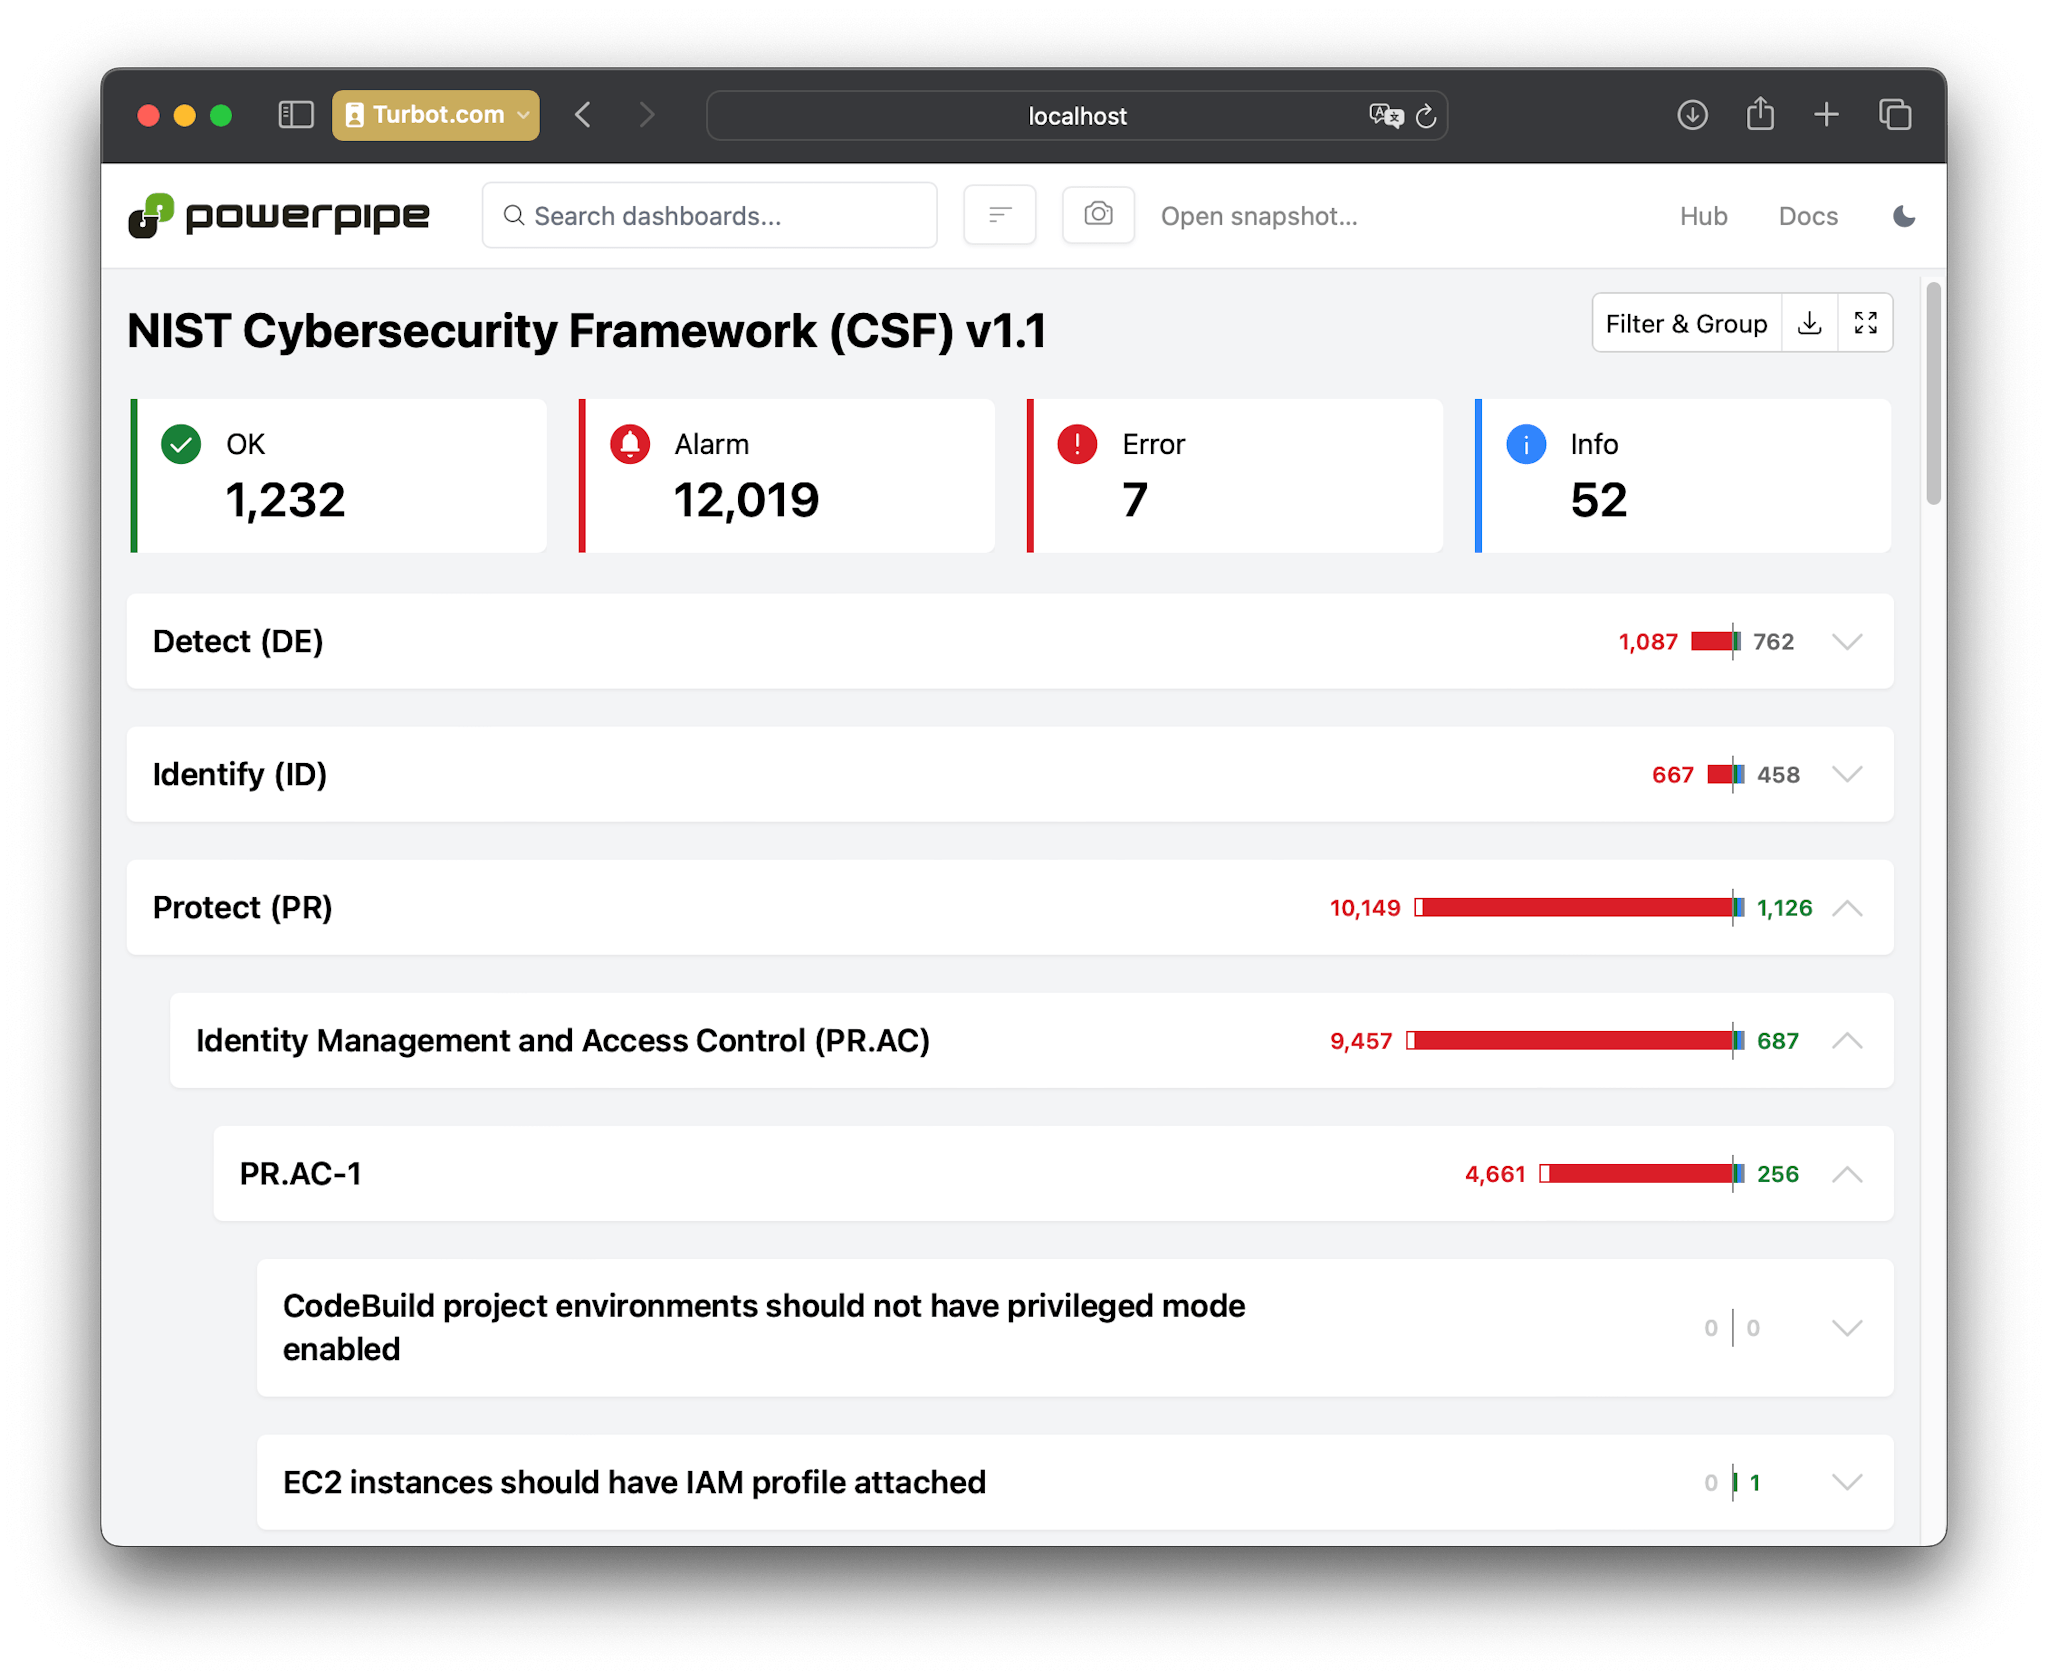
Explore your Dashboards
Powerpipe will automatically convert your benchmark data into a beautiful, locally-hosted web UI for easy filtering and grouping.
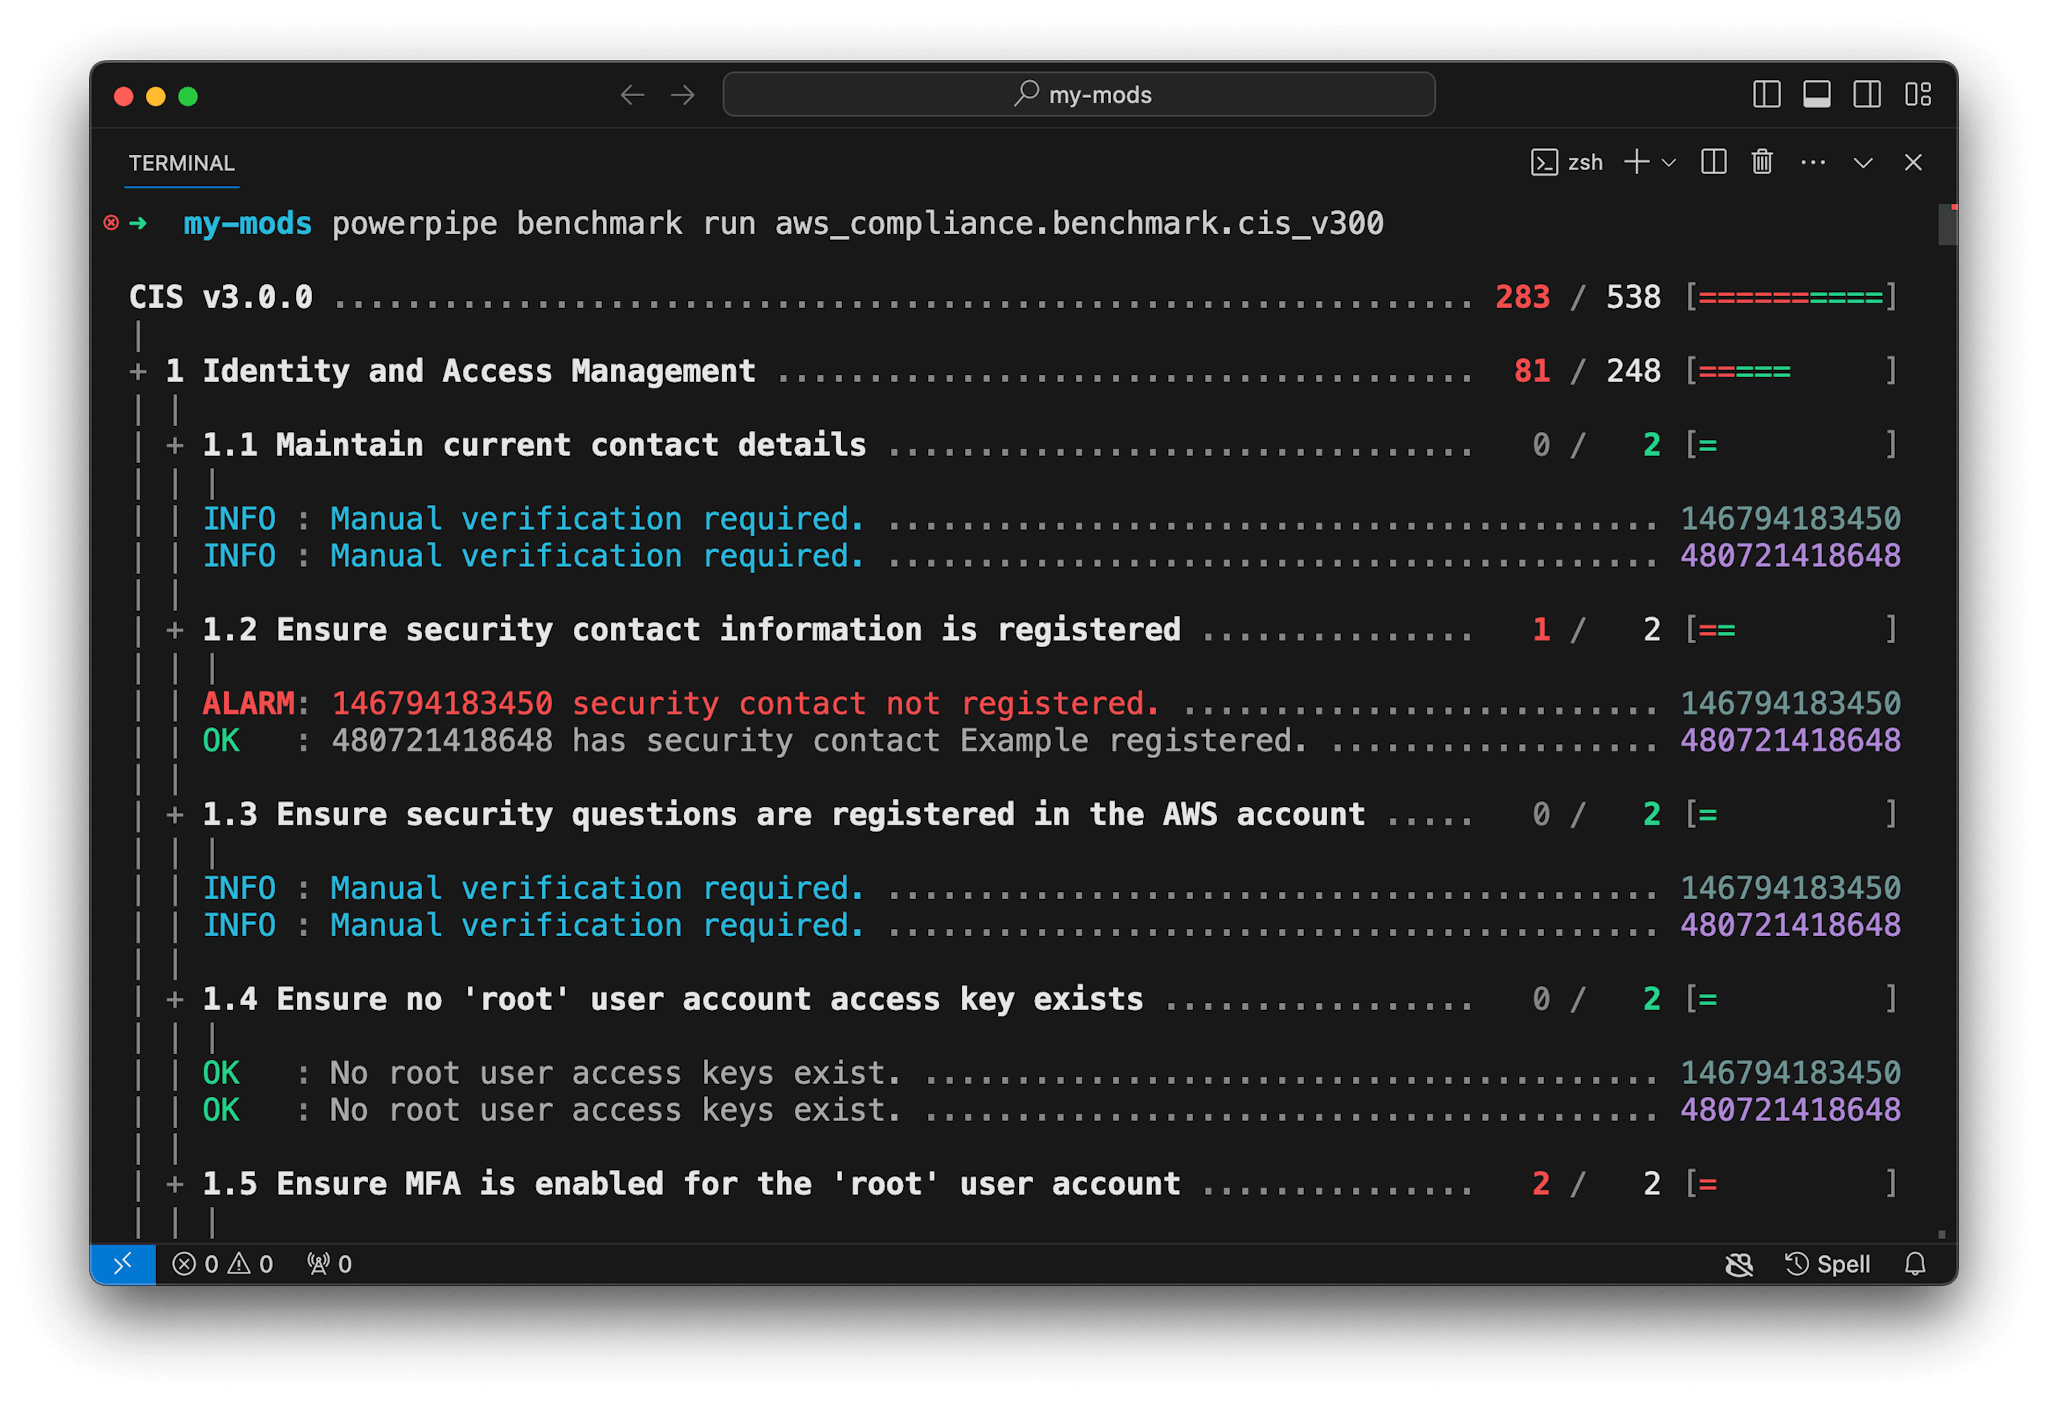
... or benchmark from the CLI
Test your connection and run benchmarks from the convenience of your CLI.
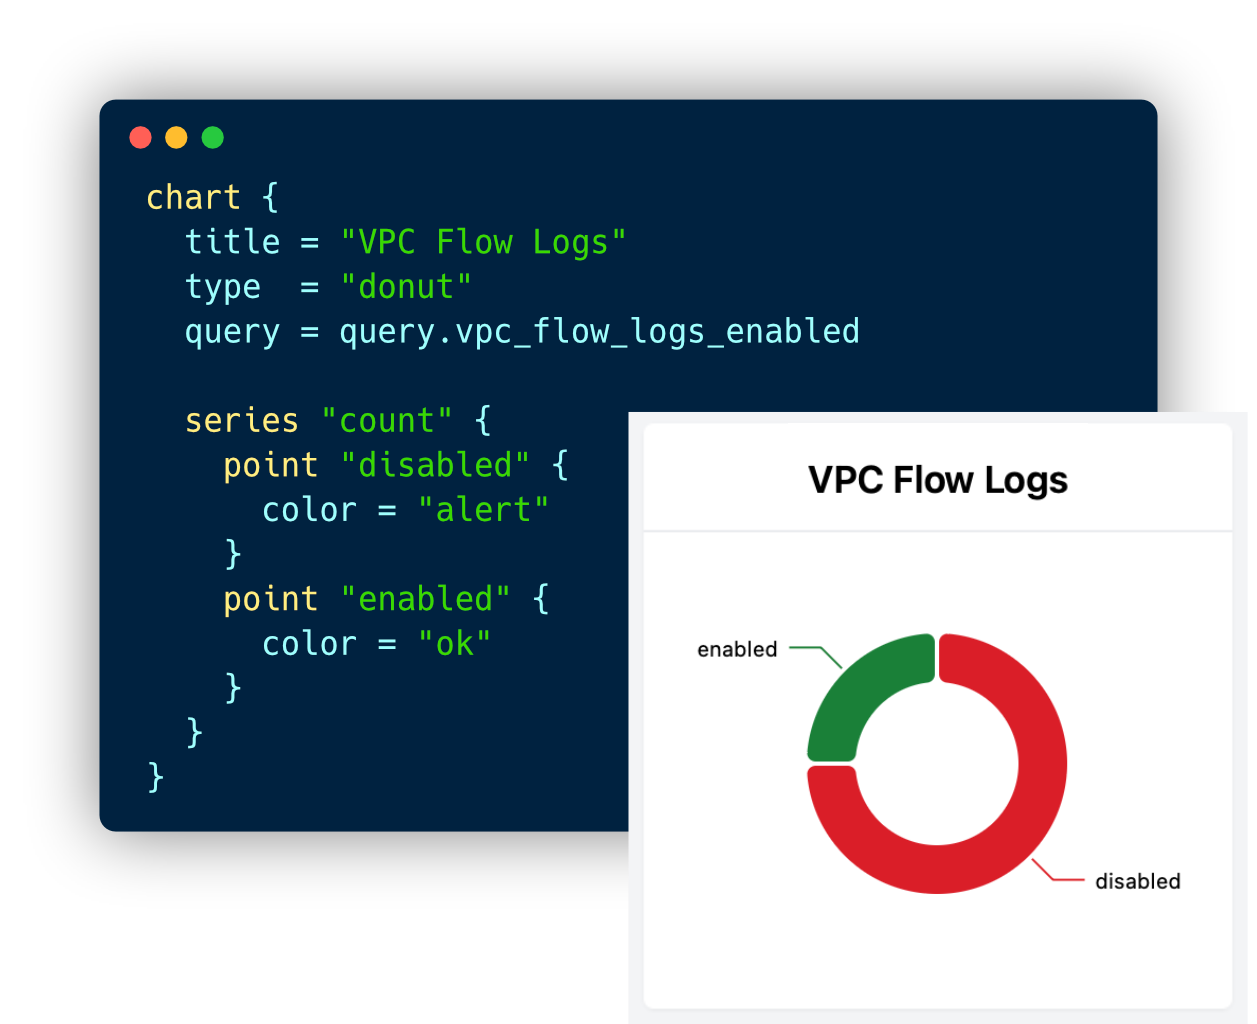
Build dashboards as code
Build complex dashboards from simple components, using HCL-based code syntax that is familiar to DevOps Teams.
Collaborate
Manage your dashboards using standard git tooling, and share what you're building with our growing community.
Demos
See Powerpipe in Action


Dashboards for DevOps.
Visualize cloud configurations. Assess security posture against a massive library of benchmarks. Build custom dashboards with code.

select * from cloud;
Drill deep into the table schemas and discover helpful example queries for 140 plugins.


select * from logs;
Open source SIEM for instant log insights, powered by DuckDB. Analyze millions of events in seconds, right from your terminal.


Workflow for DevOps.
Automate cloud operations. Coordinate people and pipelines. Build workflows as code.